
- Home
- Tutorials
- Data Science
- Hypothesis & A/B Testing
Hypothesis Testing & Modern A/B Testing Framework
In modern technology organizations, product decisions are not made by executive intuition; they are driven by rigorous empirical experimentation. Hypothesis Testing and A/B Testing provide the mathematical foundation to separate genuine causal impact from random noise.
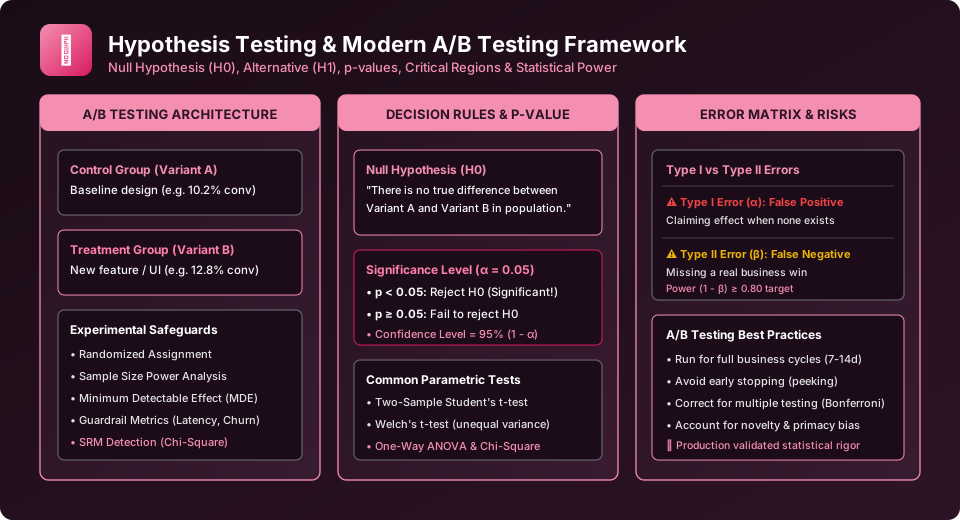
Figure 6.1: The End-to-End A/B Testing Architecture — Null Hypothesis, p-values, Critical Regions & Error Matrix.
The 5-Step Hypothesis Testing Workflow
- State the Hypotheses:
- Null Hypothesis (\(H_0\)): There is no real difference or effect (e.g., \(\mu_{\text{variant}} - \mu_{\text{control}} = 0\)).
- Alternative Hypothesis (\(H_1\)): There is a significant difference (e.g., \(\mu_{\text{variant}} \neq \mu_{\text{control}}\)).
- Select Significance Level (\(\alpha\)): Typically set to \(\alpha = 0.05\) (5% false positive risk tolerance), providing 95% confidence.
- Calculate Statistical Power & Sample Size: Ensure power \(1 - \beta \ge 0.80\) so the test has an 80%+ probability of detecting a real Minimum Detectable Effect (MDE).
- Compute Test Statistic & \(p\)-value: Evaluate data using appropriate parametric or non-parametric test routines.
- Make the Business Decision: If \(p < \alpha\), reject \(H_0\); otherwise, fail to reject \(H_0\).
The Statistical Test Selection Matrix
| Scenario & Data Type | Recommended Test | Python Implementation |
|---|---|---|
| Comparing continuous metric between 2 independent groups (e.g., Average Order Value). | Two-Sample Welch's t-test (does not assume equal variance). | stats.ttest_ind(a, b, equal_var=False) |
| Comparing continuous metric between 3+ groups (e.g., Variant A vs B vs C). | One-Way ANOVA + Tukey HSD post-hoc. | stats.f_oneway(group1, group2, group3) |
| Comparing categorical conversion rates between 2 proportions (Click-through rates). | Two-Proportion Z-Test or Chi-Square test of independence. | statsmodels.stats.proportion.proportions_ztest |
| Comparing non-normally distributed continuous data (skewed revenue). | Mann-Whitney U Test (non-parametric rank sum). | stats.mannwhitneyu(a, b) |
Hands-On Python: Full A/B Test Execution
import numpy as np
from scipy import stats

# Simulated checkout conversion revenue data
np.random.seed(101)
control_revenue = np.random.normal(loc=48.50, scale=12.0, size=2500)
treatment_revenue = np.random.normal(loc=50.20, scale=12.5, size=2500)

# Welch's t-test (Two-tailed)
t_stat, p_val = stats.ttest_ind(treatment_revenue, control_revenue, equal_var=False)

print(f"Control Mean:    $ {control_revenue.mean():.2f}")
print(f"Treatment Mean:  $ {treatment_revenue.mean():.2f}")
print(f"Lift:            $ {treatment_revenue.mean() - control_revenue.mean():.2f}")
print(f"t-statistic:     {t_stat:.4f}")
print(f"p-value:         {p_val:.5f}")

alpha = 0.05
if p_val < alpha:
    print("SUCCESS: Reject Null Hypothesis (Statistically Significant Lift!)")
else:
    print("INCONCLUSIVE: Fail to reject Null Hypothesis (Difference may be noise)")
University Viva & Exam Checklist
Key questions asked by examiners:
- Define Null Hypothesis vs. Alternative Hypothesis with real-world examples.
- Draw the Type I and Type II error matrix and explain how increasing sample size affects power.
- Why does testing multiple variants without correction lead to false discovery? (Explain the Bonferroni correction: \(\alpha_{\text{new}} = \alpha / k\)).
Frequently Asked Questions (FAQ) - Student & Interview Review
Q1. What exactly is a p-value?
Q2. What is the difference between Type I and Type II errors?
Q3. When should I use a two-sample t-test vs ANOVA?
Q4. What is Sample Ratio Mismatch (SRM) in A/B testing?
Q5. Why is 'peeking' at A/B test results dangerous?
Explore Related Data Science Tutorials & Next Steps
Broaden your statistical analysis, Python data wrangling, and production engineering expertise:
Learn the theoretical distributions underpinning t-tests, Z-tests, and Chi-Square.
Calculate sample size requirements and minimum detectable effect (MDE).
Measure feature adoption and A/B test lift using SQL window queries.
Practice answering tough statistical interview questions asked by top tech firms.


You may also like this!
© Veewom.com. | Managed by PinePL
