
- Home
- Tutorials
- Machine Learning
- Classification Metrics & ROC-AUC
Classification Metrics: Confusion Matrix, Precision, Recall, F1 & ROC-AUC
In classification, Accuracy (the percentage of total correct predictions) is often dangerously misleading. For example, in fraud detection where only 0.1% of transactions are fraudulent, a trivial model that blindly predicts "Legitimate" for every transaction achieves 99.9% accuracy — yet is completely useless because it fails to catch a single criminal fraud event!
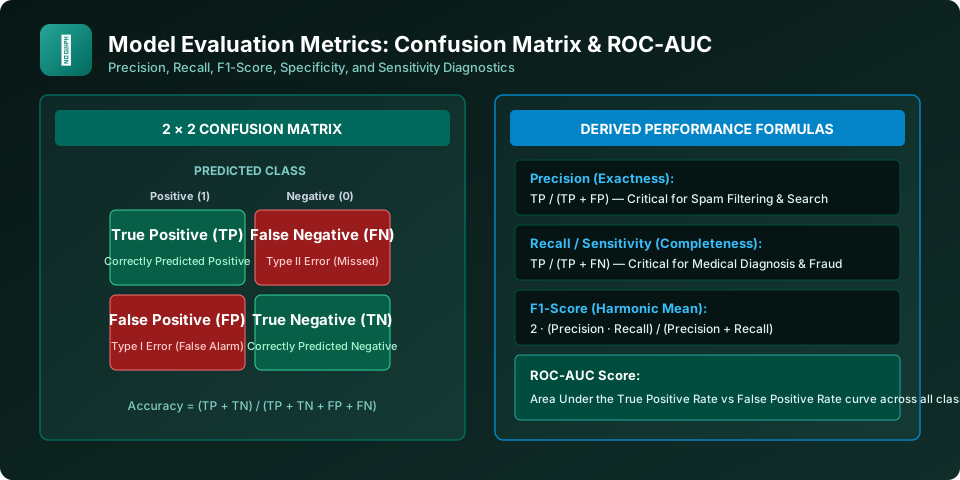
Figure 20.1: The Confusion Matrix Grid and Derived Evaluation Metrics (Precision, Recall, F1, and ROC-AUC).
The 2 × 2 Confusion Matrix
| Actual Class | Predicted Positive (1) | Predicted Negative (0) |
|---|---|---|
| Actual Positive (1) | True Positive (TP): Correctly flagged as positive. | False Negative (FN): Missed event (Type II Error). |
| Actual Negative (0) | False Positive (FP): False alarm (Type I Error). | True Negative (TN): Correctly identified as negative. |
Derived Performance Metrics: Precision, Recall & F1-Score
Precision vs. Recall Tradeoff
Precision: Out of all samples predicted as positive, how many were actually positive? Precision = TP / (TP + FP). Crucial when False Positives are costly (e.g., spam filter moving important emails to junk).
Recall (Sensitivity): Out of all truly positive samples, how many did the model find? Recall = TP / (TP + FN). Crucial when False Negatives are catastrophic (e.g., cancer diagnosis or airport weapons screening).
F1-Score: The harmonic mean balancing precision and recall: F1 = 2 · (Precision · Recall) / (Precision + Recall).
The ROC-AUC Metric (Receiver Operating Characteristic)
The ROC Curve plots True Positive Rate (Recall) against False Positive Rate (FPR = FP / (FP + TN)) across every possible classification threshold from 0.0 to 1.0. The AUC (Area Under the Curve) summarizes performance into a single scalar:
- AUC = 1.0: Perfect model; cleanly separates all positives from negatives.
- AUC = 0.50: Worthless model; performs no better than flipping a fair coin.
- AUC > 0.85: Excellent discrimination threshold across operating points.
Frequently Asked Questions (FAQ) - Student & Interview Review
Q1. Why use the Harmonic Mean for F1-Score instead of the Arithmetic Mean?
Q2. When is Precision-Recall AUC (PR-AUC) better than ROC-AUC?
Q3. What is Cohen's Kappa score?
Explore Related Machine Learning Tutorials & Next Steps
Broaden your foundational and advanced Machine Learning knowledge across our curriculum:
Calibrate decision thresholds from 0.5 to custom operating points.
Track accuracy, precision, and concept drift over time.
Why PR-AUC is preferred over ROC-AUC on imbalanced datasets.
Calculate sensitivity, specificity, and F1-score by hand.


You may also like this!
© Veewom.com. | Managed by PinePL
